
Collector Car Market Trends 2026
A daily snapshot of the collector car market. Track total recorded sold volume, sell-through rates, and the Fear & Greed Index across qualifying public auction and marketplace records. Below you'll also find the week's most popular listings, biggest sales, and which models are appreciating or depreciating.
Cars That Hold Their Value
Cars that sold for more (or less) than their previous recorded sale, ranked by appreciation percentage
Top Appreciating Models
Avg. price appreciation year over year
Top Depreciating Models
Avg. price depreciation year over year
Classic Car Auction Results
Most-engaged listings and highest sales across tracked sources
Popular Listings
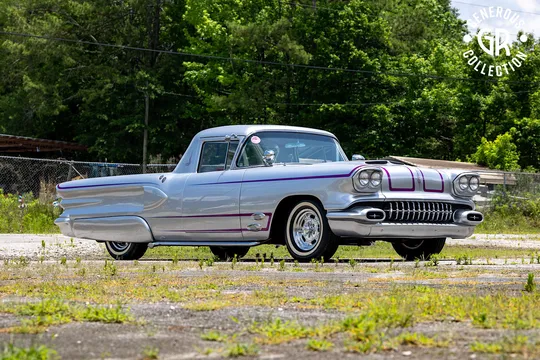 1958 Pontiac Star Chief Custom Safari Wagon “Pontimino”$45,250
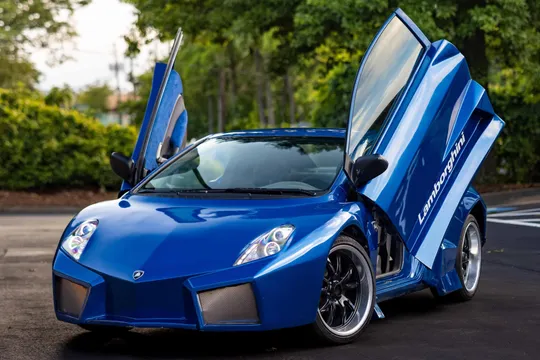 2009 Honda Civic LX Lamborghini Aventador Replica$16,750
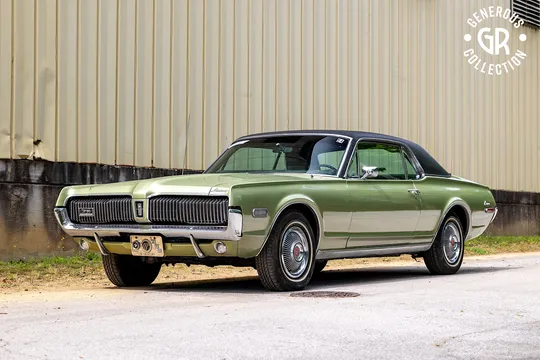 1968 Mercury Cougar 302$18,500
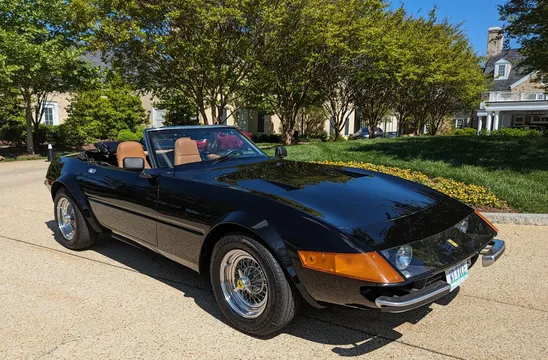 Ferrari 365 GTS/4 Daytona Spyder Replica$46,500
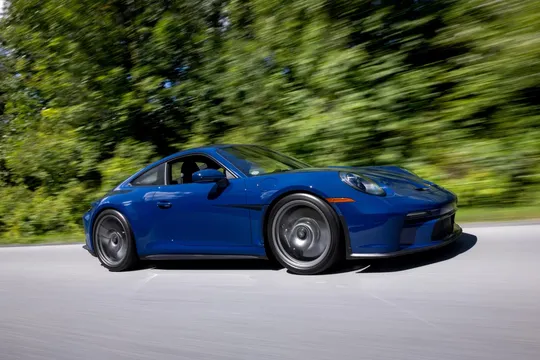 196-Mile Albert Blue 2024 Porsche 911 S/T$805,000
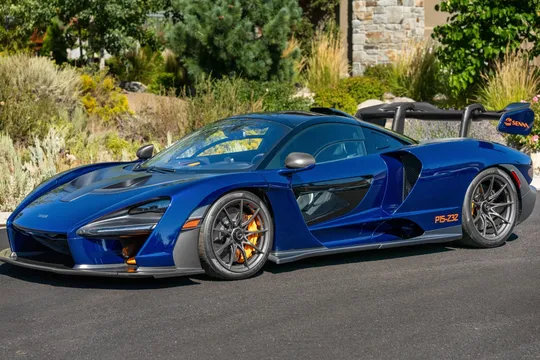 2019 McLaren Senna$1,976,000
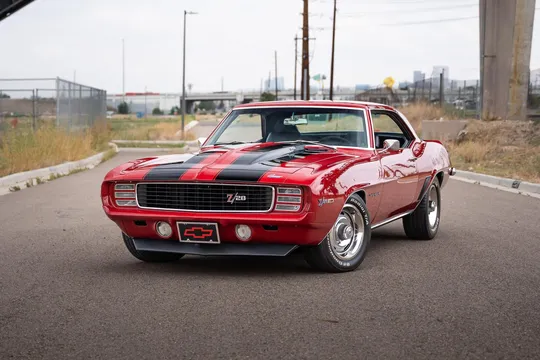 1969 Chevrolet Camaro Z/28 Coupe 4-Speed$86,500
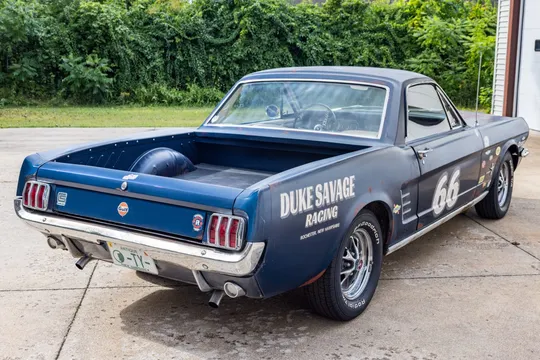 302-Powered 1966 Ford Mustang “Mustero” Pickup Conversion$36,000
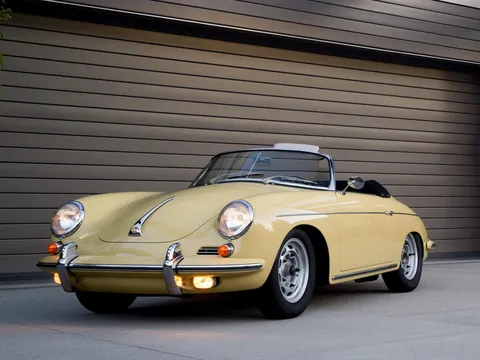 1962 Porsche 356B Twin Grille Roadster$541,000
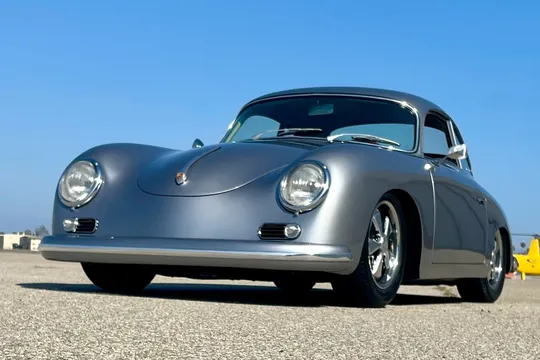 Twin-Plug 2.7L Flat-Six-Powered 1957 Porsche 356A Coupe 5-Speed$180,000
Highest Sold
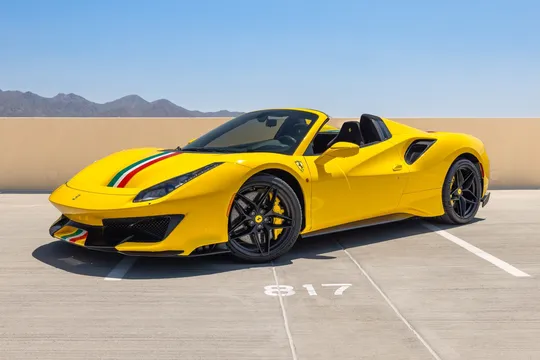 2020 Ferrari 488 Pista Spider$1,510,000
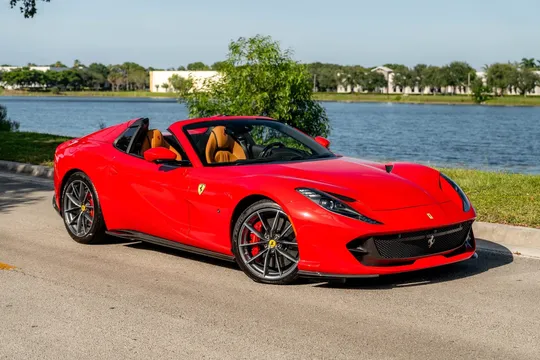 2023 Ferrari 812 GTS$897,0002024 Porsche 911 S/T$805,000
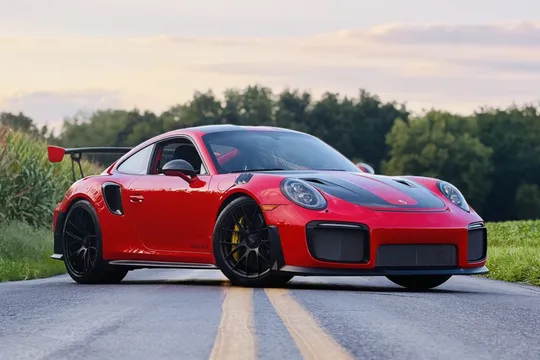 2018 Porsche 911 GT2 RS Weissach$805,000
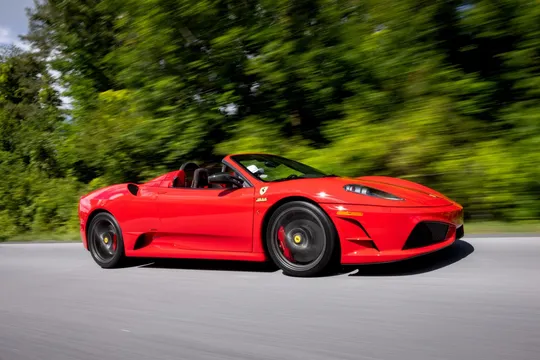 2009 Ferrari F430 Scuderia Spider 16M$760,000
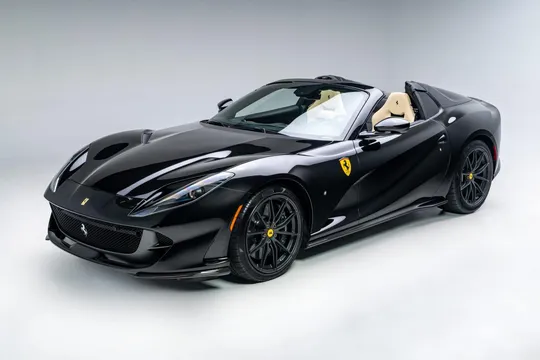 2021 Ferrari 812 GTS$750,000
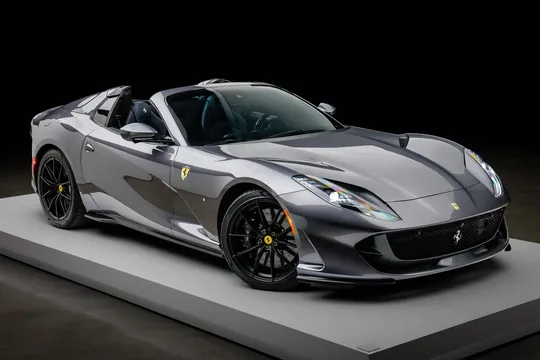 2021 Ferrari 812 GTS$735,000
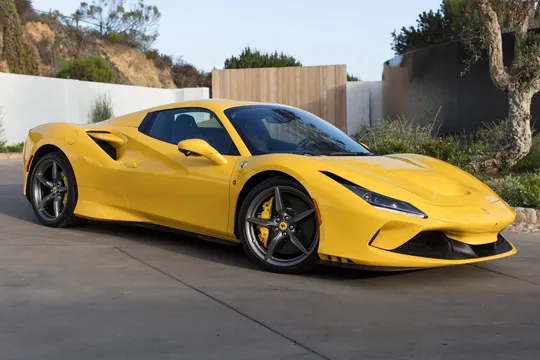 2022 Ferrari F8 Spider$640,000
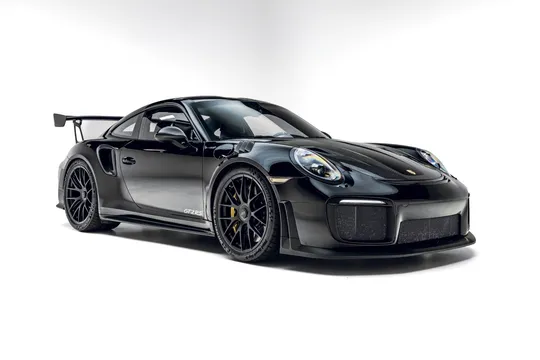 2018 Porsche 911 GT2 RS Weissach$615,000
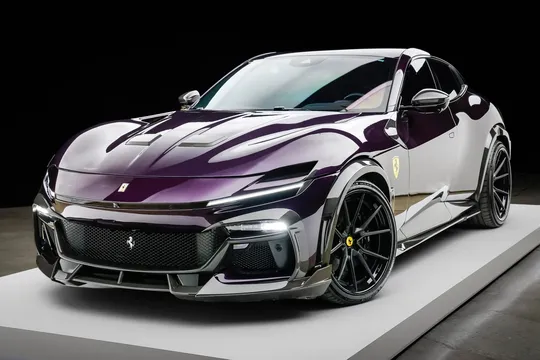 2024 Ferrari Purosangue$551,111
The high-end, classic, and enthusiast car market processed $59,679,064 in volume over the last 7 days across auctions and fixed-price listings. The seven-day average sell-through rate was 62%. The Hypercars Fear & Greed Index stands at 27 (Fear).
Fear & Greed compares a seven-day observation window with the preceding 90 days using average daily sold volume, average daily median bid activity per ended auction, and sell-through rate.
Data comes from qualifying public records across tracked auctions and marketplaces. Updated daily.
Is the Classic Car Market Crashing?
Market conditions vary materially by segment. No single activity index or seven-day observation can establish whether every part of the market is rising or falling.
Use the volume and sell-through charts to understand current activity, then refine by make, model, and submodel before drawing a vehicle-specific conclusion.
If you're buying or selling, compare the specific car with current verified transactions. Use our car valuation tool to check current values based on real transaction data.
Latest collector car market report
For a month-by-month view of sales volume, pricing, platform performance, and appreciation leaders, read the latest monthly market report.
Understanding Sell-Through Rate
Sell-through rate is the percentage of ended auctions that sell. It is one useful view of observed demand relative to supply, but it should be read alongside the period, sample size, vehicle mix, and source coverage.
The charts above track qualifying outcomes over time. Interpret each rate with its source coverage, sample size, and observation period rather than assuming one platform always leads. Planning to sell? Use our platform comparison tool to find the right platform for your car.
Frequently Asked Questions
What does the Fear & Greed Index measure?
The Hypercars Fear & Greed Index is a composite market-activity and demand indicator. It equally weights average daily sold volume, average daily median bid activity per ended auction, and sell-through during the latest seven days, each normalized against the preceding 90-day baseline. It is not a price forecast or a literal measurement of emotion.
How is daily volume calculated?
Daily volume is the total dollar amount of qualifying public sales across tracked sources on a given day. We count completed sales with convertible prices, not active bids or asking prices.
Is the classic car market crashing in 2026?
No single index can answer that for every segment. Review current volume, sell-through, recent sales, and vehicle-specific values. The Fear & Greed score summarizes recent activity and demand relative to its own 90-day baseline; it is not a market forecast.
What does the appreciation ratio mean?
The appreciation panel shows cars that have sold for more (or less) than their previous sale on record. A car with a positive appreciation percentage sold for more than it last traded for. This helps identify which makes and models are gaining or losing value over time.
Where does the market data come from?
The data comes from Hypercars' continuous tracking of public collector-car auctions and marketplaces. Qualifying statistics exclude hidden, duplicate, quality-flagged, future-dated, and parts records. We track 4,000,000+ listings and update these metrics daily.