
Cars That Are Appreciating the Most in 2026
Summary
This list ranks models by realized price movement — this year's average sale price against last year's, from real sold listings on both sides. The headline mover is the Nissan R33 Skyline GT-R, whose 12-month average more than doubled as import-eligible cars flooded in. Gated-era Ferraris (F355 Spider up 75%, 512 TR up 43%) and Porsche GT cars (996 GT2, 997 GT3, 996 GT3) fill much of the rest, alongside blue-chip classics like the Series 1 Jaguar E-Type, up 60% on 82 sales this year. For cars that resist decline rather than climb, see our hold-their-value guide.
Rankings
- 1
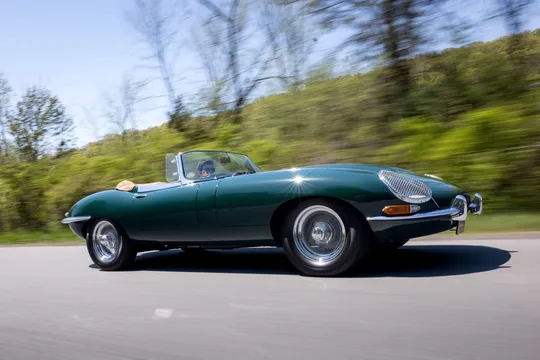
- 2
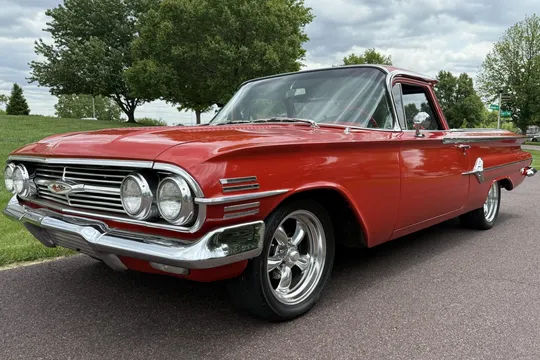
- 3
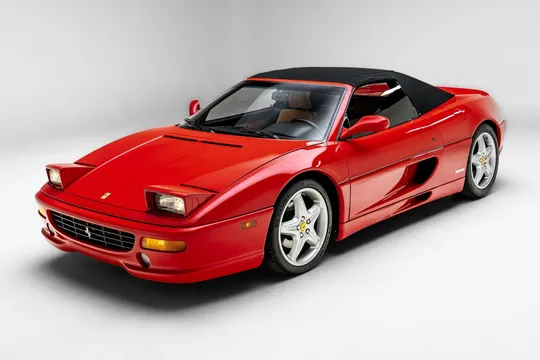
- 4
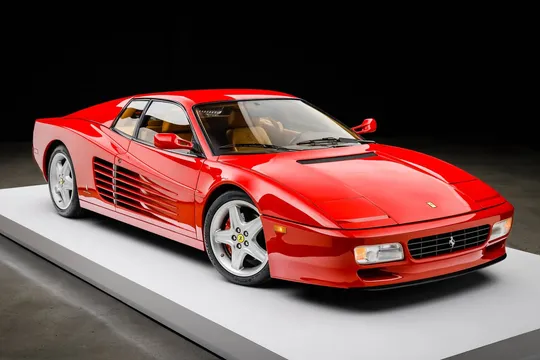
- 5
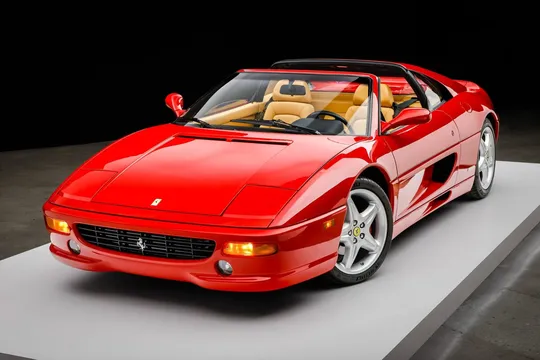
- 6

- 7
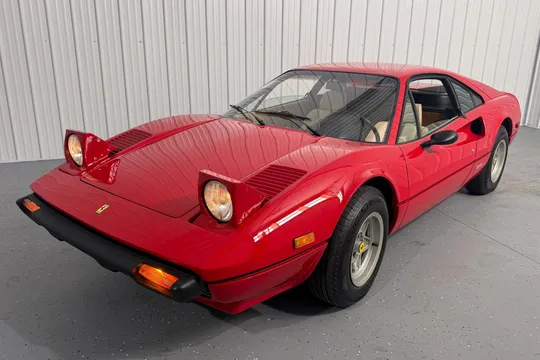
- 8
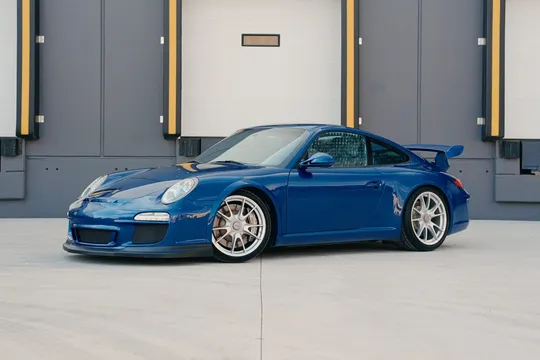
- 9
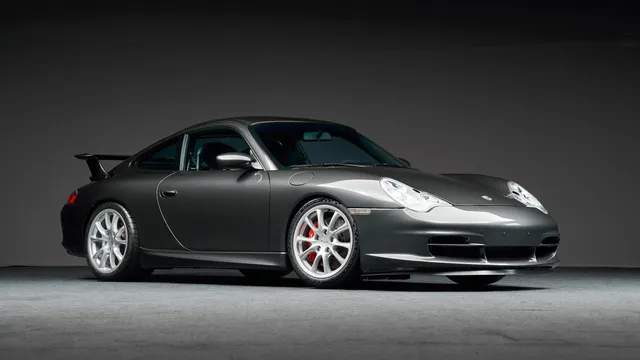
- 10
- 11
- 12
- 13
- 14
- 15
Comparison
| Model | Avg Price | Typical Range | Sales | 12-mo Trend | Est. YoY | Avg Mileage |
|---|---|---|---|---|---|---|
| Jaguar E-Type Series 1 | $189,439 | $44,609 – $225,400 | 105 | — | -0.1% | 44,526 |
| Chevrolet El Camino 1st Gen | $62,364 | $7,640 – $184,260 | 25 | +71.1% | +0.9% | 35,451 |
| Ferrari F355 Spider | $133,251 | $71,210 – $281,750 | 72 | +62.9% | +0.4% | 25,517 |
| Ferrari 512 TR | $319,436 | $159,986 – $639,500 | 28 | +52.3% | -0.2% | 26,707 |
| Ferrari F355 GTS | $165,677 | $71,135 – $279,350 | 18 | +49.8% | +0.8% | 33,129 |
| Chevrolet Corvette Callaway | $47,017 | $20,662 – $101,750 | 16 | +48.8% | -1.0% | 29,378 |
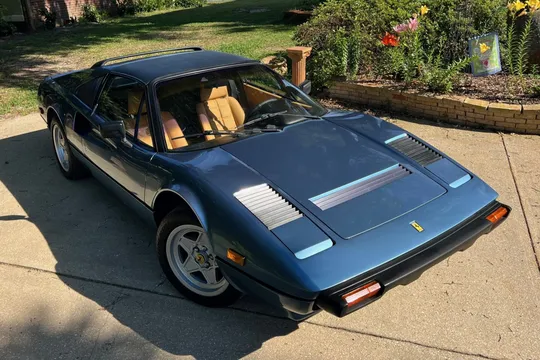
| Ferrari 308 GTB | $104,061 | $54,010 – $191,440 | 35 | +48.1% | +0.0% | 36,875 |
| Porsche 997 GT3 | $155,045 | $78,511 – $234,400 | 35 | +47.5% | +1.5% | 30,895 |
| Porsche 996 GT3 | $112,395 | $63,500 – $145,250 | 41 | +43.8% | -0.1% | 40,507 |
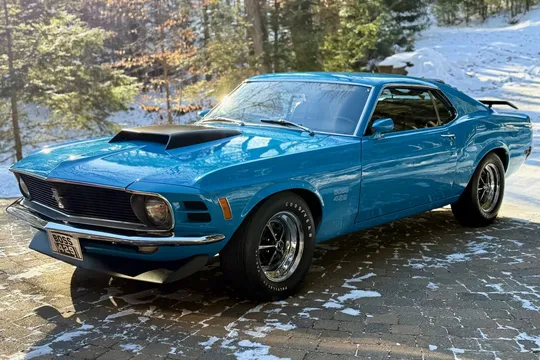
| Ford Mustang Boss 429 1st Gen | $409,441 | $180,600 – $660,000 | 22 | +41.3% | +0.7% | 21,364 |
| Ferrari 308 GTS QV | $106,741 | $59,775 – $194,835 | 32 | +38.3% | +0.3% | 33,324 |
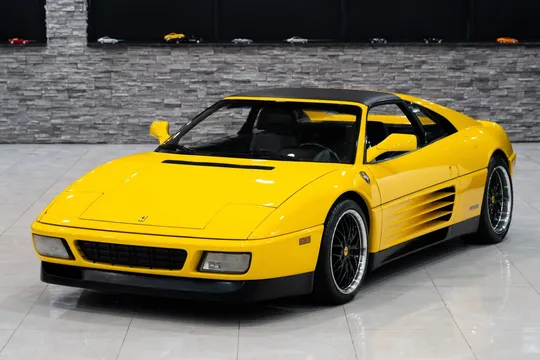
| Ferrari 348 ts | $85,224 | $59,400 – $159,696 | 38 | +37.5% | -0.3% | 29,082 |
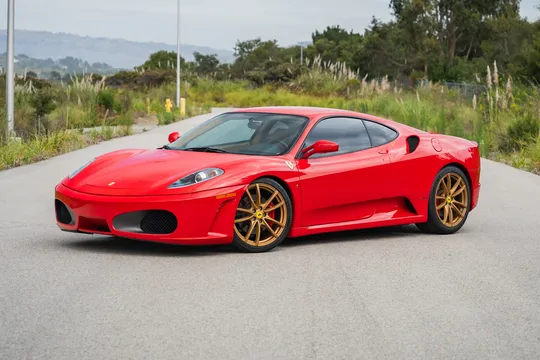
| Ferrari F430 Berlinetta | $198,253 | $78,557 – $429,750 | 42 | +37.3% | -0.2% | 15,859 |
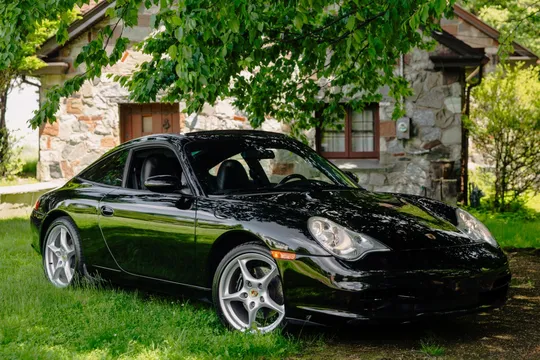
| Porsche 996 Targa | $29,014 | $15,258 – $55,450 | 25 | +35.8% | -0.6% | 80,458 |
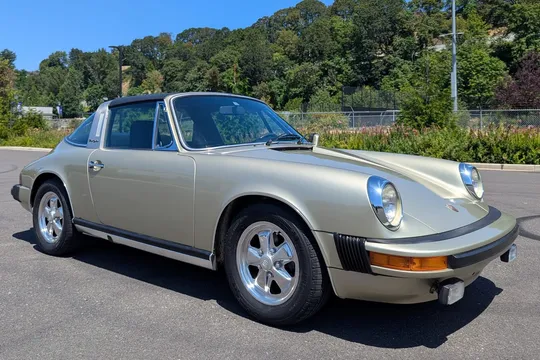
| Porsche 911 G-Body | $74,070 | $26,053 – $171,887 | 122 | +35.6% | +0.8% | 73,880 |
How to Choose
- Check both windows before acting on a trend: every car here has at least 8 sales in each of the last two 12-month periods, but composition still shifts — a wave of low-mile cars can move an average.
- Import eligibility is the strongest force on this list. The R33 import wave began in 2020, 1999-2001 R34 GT-Rs became eligible from 2024, and the final 2002 cars arrive in 2027.
- Manual transmissions consistently outperform automatics in appreciation across all makes.
- Condition matters more than mileage. Concours-quality examples command exponential premiums.
- Watch out for speculation bubbles. Some models spike quickly then correct. Steady, gradual appreciation is more sustainable.
Frequently Asked Questions
- What cars are going up in value in 2026?
- In our sales data, the R33 Skyline GT-R (12-month average up over 120%), Ferrari F355 (up 75% for Spiders), Jaguar E-Type Series 1 (up 60%), and Porsche GT cars like the 996 GT2 and 997 GT3 (up 45-55%) are the strongest realized movers.
- Is now a good time to buy a collector car?
- The market is more balanced than the 2021-2022 peak. Prices for many models have corrected 10-20%, making it a reasonable entry point. That said, the most desirable models haven't dropped much — see our undervalued classics guide for the segments that have.
- How do you track car appreciation?
- This ranking compares each model's average sold price over the last 12 months against the 12 months before, using only real sales with at least 8 transactions in each window. The YoY badge shown on each card is a separate model-based estimate.
- What classic cars are the worst investment?
- High-production luxury cars, non-performance SUVs, and automatic-transmission versions of otherwise collectible sports cars tend to lose the most value. Our sports car depreciation guide ranks the fastest fallers.
- Should I store or drive an appreciating car?
- For most sub-$200K collector cars, driving them moderately (2,000-4,000 miles per year) doesn't hurt value much. Low-mileage examples command premiums, but garage queens have their own risks (dried seals, flat-spotted tires).
Methodology and sources
Based on 656 sold listings from the last 2 years across Bring a Trailer, Cars & Bids, eBay Motors, PCarMarket, Collecting Cars, and other auction and marketplace sources. Prices are normalized to USD. Typical ranges show the 5th–95th percentile of sold prices. Stats update daily.
Related Guides
- Cars That Hold Their Value Best in 2026Which collector and enthusiast cars retain the most value, ranked by real appreciation data
- Future Classic Cars to Buy in 2026Sleeper picks: modern cars quietly gaining value that aren't yet recognized as collectibles
- Most Undervalued Classic Cars to Buy in 2026Classic cars that have corrected the most from peak prices, buying opportunities backed by real sales data
- Porsche 911 Turbo as an Investment: Price Trends and AnalysisData on Porsche 911 Turbo values across all generations with investment analysis
- Sports Car Depreciation Rates: Which Models Lose Value FastestData on which sports cars depreciate the most, ranked by real price trends